6 Types of Original Blog Visuals You Must Include in Your Posts

It’s established: regardless of how interesting your topic is or how well you write, a blog post without visuals is drab.
There is no way you can subject readers to large chunks of paragraphs and expect them to remain engaged.
This is why an important blogging tip to consider is to include at least 10 images in a 2,000-3,000-word blog post. Studies suggest that the more visuals a blog post has, the more likely it is to succeed.
But does that mean you can include stock photos in your articles and consider your work done? Not really.
As per an eye-tracking study, people tend to ignore stock photos of generic people. This isn’t surprising because stock photos are so overused. They aren’t relatable and add no value to the blog post.
So, it’s high time you move on from generic stock photography and use original graphics in your blog posts instead.
Let’s take a look at the six types of original blog visuals you must include in your blog posts.
-
Infographics
Write a paragraph of text and people might not get to the end of it, but communicate the same information in the form of an infographic and it’s likely to get read. That’s the power of infographics.
Infographics are a collection of images, charts, illustrations, and minimal text. They are used to give an easy-to-understand overview of a topic.
Being unique and engaging visuals, infographics are a useful addition to blog posts because they not only capture attention but also communicate information in an easily digestible manner.
You can use infographics in your blog posts to:
- Provide a quick overview of a topic
- Compare and contrast scenarios
- Present research findings and survey data
- Summarize a long blog post
Here’s an example of a Venngage blog post on the biggest graphic design trends. It summarizes the trends in the form of an infographic and elaborates on each of the trends in the blog post.
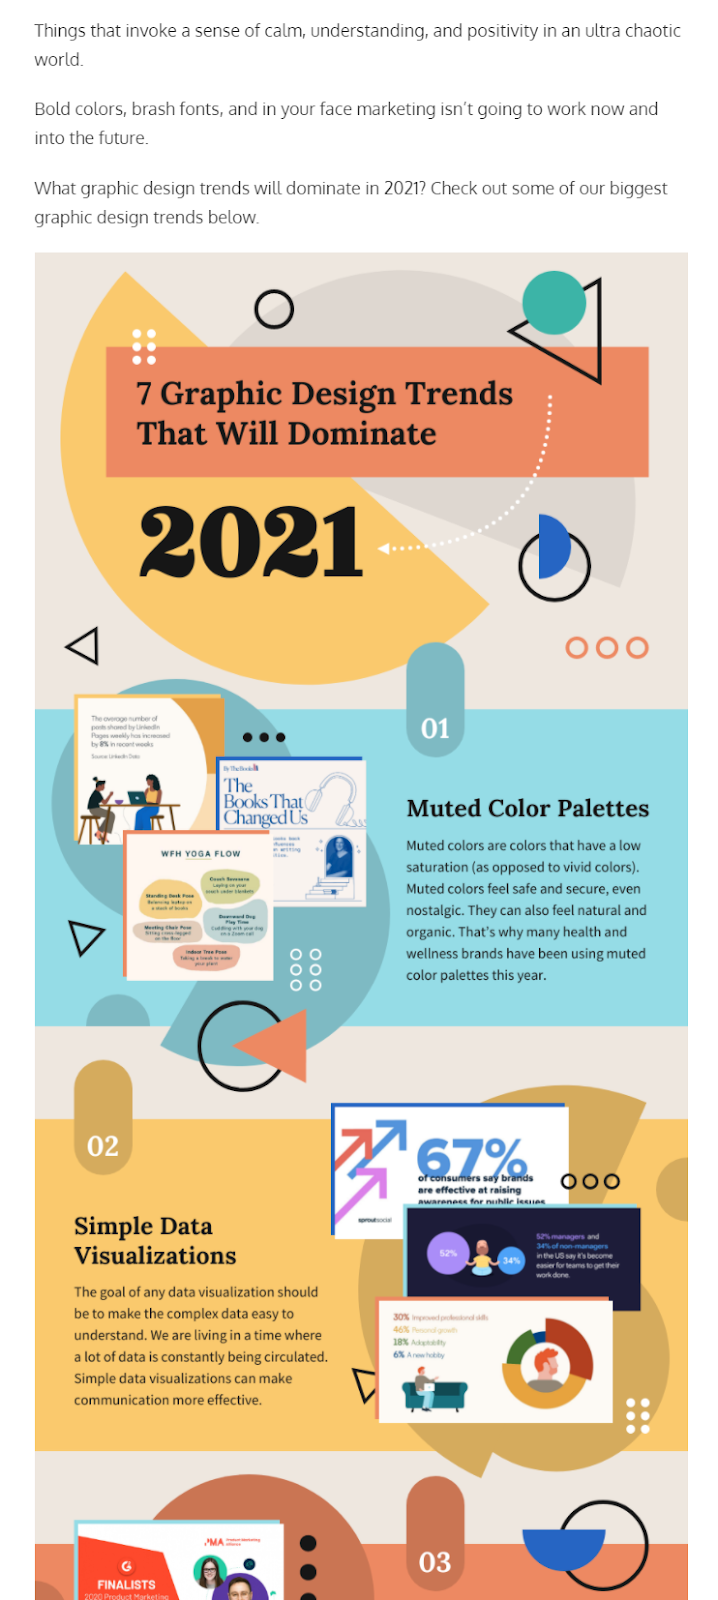 Source: Venngage
-
Charts
Data is fascinating and certainly makes for compelling content.
Whether you’re presenting research findings, creating a narrative with public data, or leveraging internal data to share insights, what’s important is knowing how to present that data.
This is where charts come into the picture. They offer clarity and let readers process data with ease, helping you communicate your story effectively.
You can use a graph maker to create different types of charts in your blog posts:
- Donut charts to communicate a single data point
- Bar charts, bubble charts, and pie charts to compare categories
- Line charts and area charts to demonstrate change over time
- Scatter plots and multi-series charts to reveal relationships
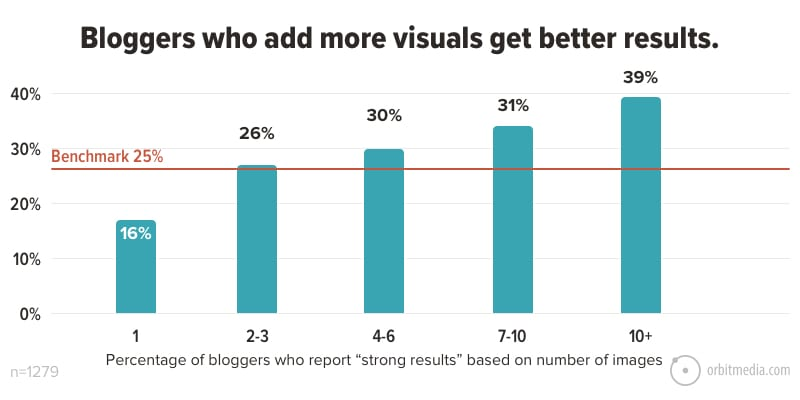
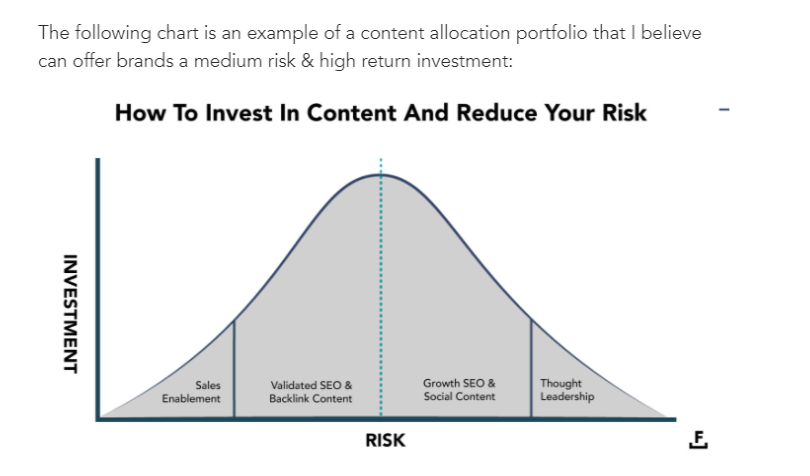
Here’s an interesting use of a chart in a blog post by Foundation. It complements the message and helps readers get a quicker and more accurate understanding of the topic in question.
-
Diagrams
While charts and graphs are used to communicate data, there might be instances when you might need to explain a multi-step process or represent decision points.
This is where you can use process diagrams.
The different types of process diagrams include:
- Flow charts
- Decision trees
- Mind maps
- Workflow diagrams
- Customer journey maps
They make for effective blog visuals because they help you communicate complex processes and technical information without overwhelming the reader.
You can use different shapes to represent the different steps in the process and arrows or lines to show the relationship between them.
Here’s an example of an Intercom blog post that uses a flowchart to explain a chatbot conversation flow.

-
GIFs
While static images are great, one can’t deny the effectiveness of animated GIFs. The Graphics Interchange Format (GIF) is an animated image with no sound.
Owing to their dynamic nature, they are more effective in capturing attention and driving engagement than static images.
Here are the different ways to use GIFs in your blog posts:
- Show a product in action
- Demonstrate steps of a process
- Animate data
- Showcase your brand personality
- Convey an emotion
- Add humor
You can either create GIFs from scratch or find relevant ones on GIPHY.
Make sure you don’t get carried away and use too many GIFs in one blog post as it might interfere with the reading experience.
Here’s an example of a GIF in a Drift blog post.

-
Videos
It’s interesting to note that people spend 2.6x more time on pages with videos than without. This signals Google that your content is useful which in turn helps increase organic search engine rankings.
What’s more, with shrinking attention spans, videos are more likely to appeal to people and retain their attention. From attracting traffic and capturing attention to being engaging and easy-to-consume, videos serve as valuable blog visuals.
Here are some video content ideas for your blog posts:
- Summarize the blog post
- Outline the key takeaways from the post
- Create an instructional video or product demo
- Feature a customer testimonial
- Demonstrate quick tips or DIY hacks
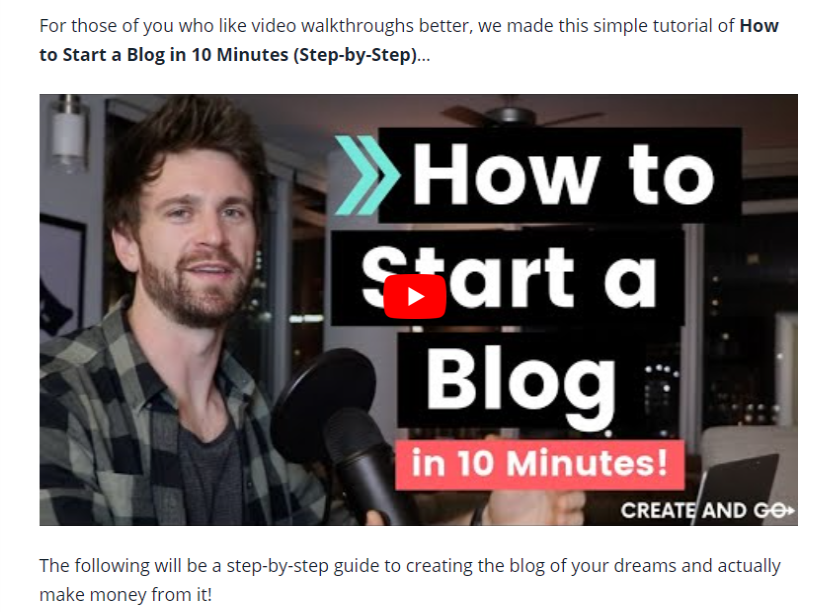
Remember: if you’re embedding a video in a blog post, make sure you mention it in the blog headline. This lets people know the post contains a video and is likely to attract more clicks.
Take a look at this blog post by Create and Go. It has a video embedded early on in the article, giving readers an option to either watch the video or read the entire blog post.
-
Screenshots
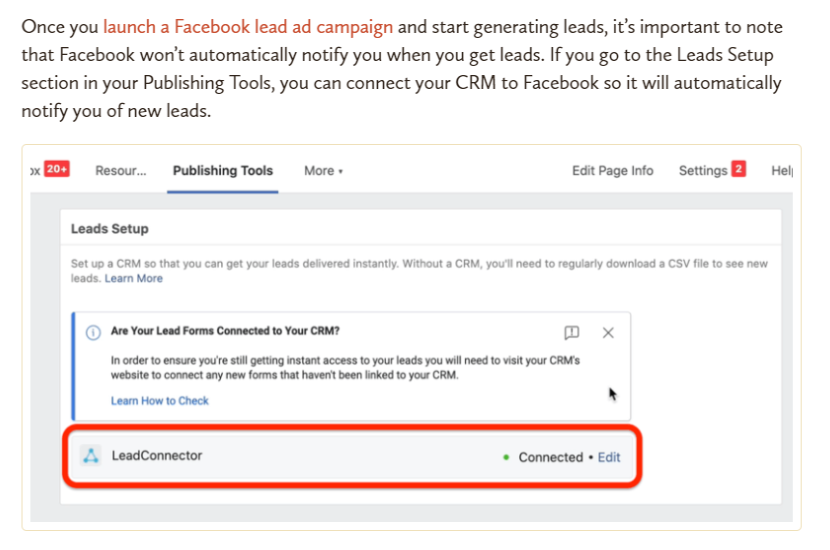
Let’s say you’re writing an educational blog post. Instead of making it text-heavy, it’s a good idea to complement the article with meaningful screenshots. They add value to the post and aid comprehension.
Make sure you annotate the screenshot by adding arrows or highlighting relevant sections to offer greater clarity. Screenshots are a cost-effective option and strengthen your content.
You can use a tool such as Awesome Screenshot to capture screenshots and record your screen.
Here’s an example of a Social Media Examiner blog post with a screenshot. Notice how a certain section is boxed-in for emphasis.
The takeaway: create original blog visuals to engage readers
Humans are visual creatures. A block of text can never be as effective as a meaningful visual.
Apart from conveying your message clearly, well-designed blog visuals also compel people to share your content with their networks.
While incorporating visuals in your blog posts should be part of your content marketing strategy, make sure you take the effort to create original blog visuals that add value to your posts and keep readers engaged.
Simki Dutta is a content marketer at Venngage, a free infographic maker and design platform. She writes about all things marketing and communications. Find her on Twitter and LinkedIn.